evaluate the refinement of the display functionality for warehouse operations
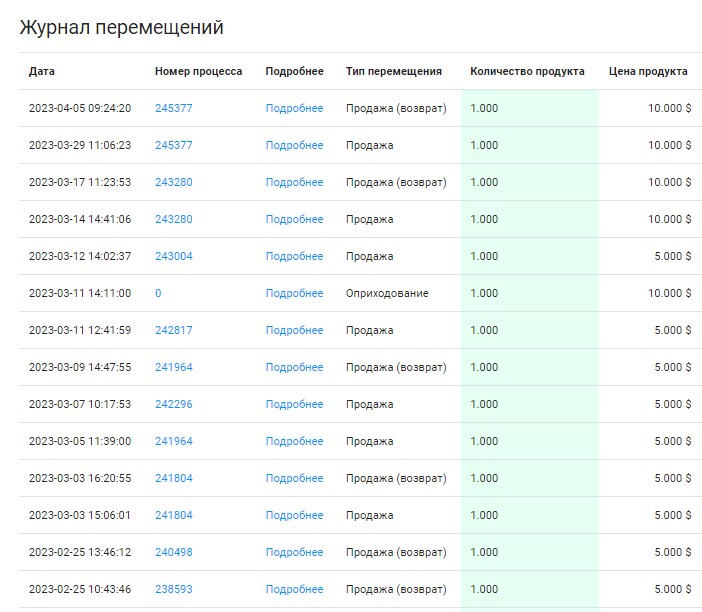
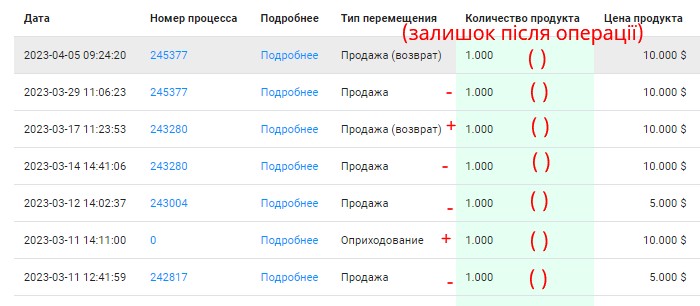
I miss when viewing the Warehouse operations for the product in this format
this makes it possible to understand how quickly the balance ends, to adjust purchases more quickly
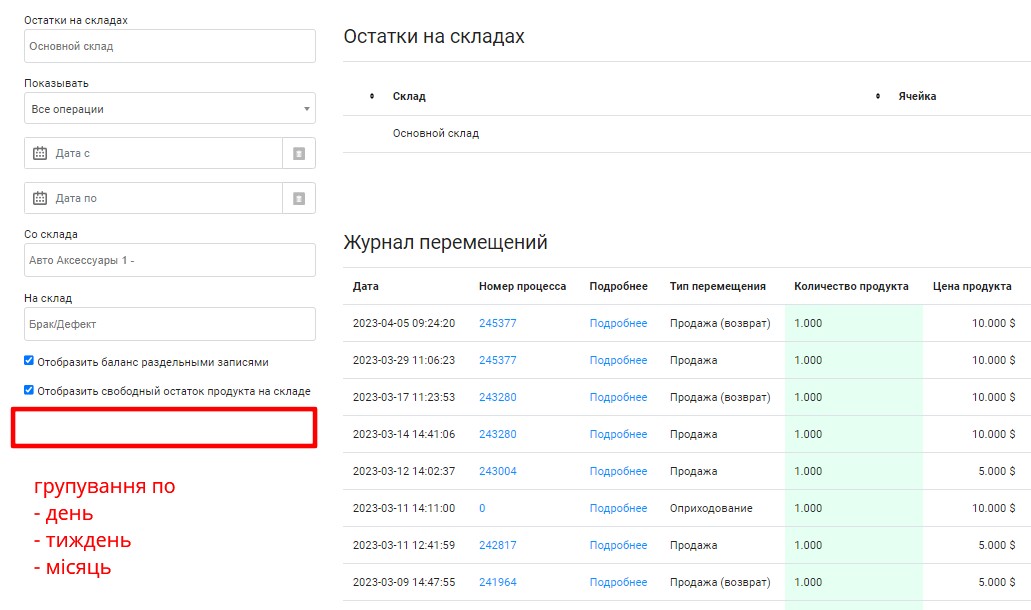
It is also interesting to add the option to select a display with grouping in the filter
- day
- a week
- month
and an additional checkmark for this functionality is the sales schedule in the selected periods, which was displayed below when you select such a function
all this to increase the analysis of the sale of goods
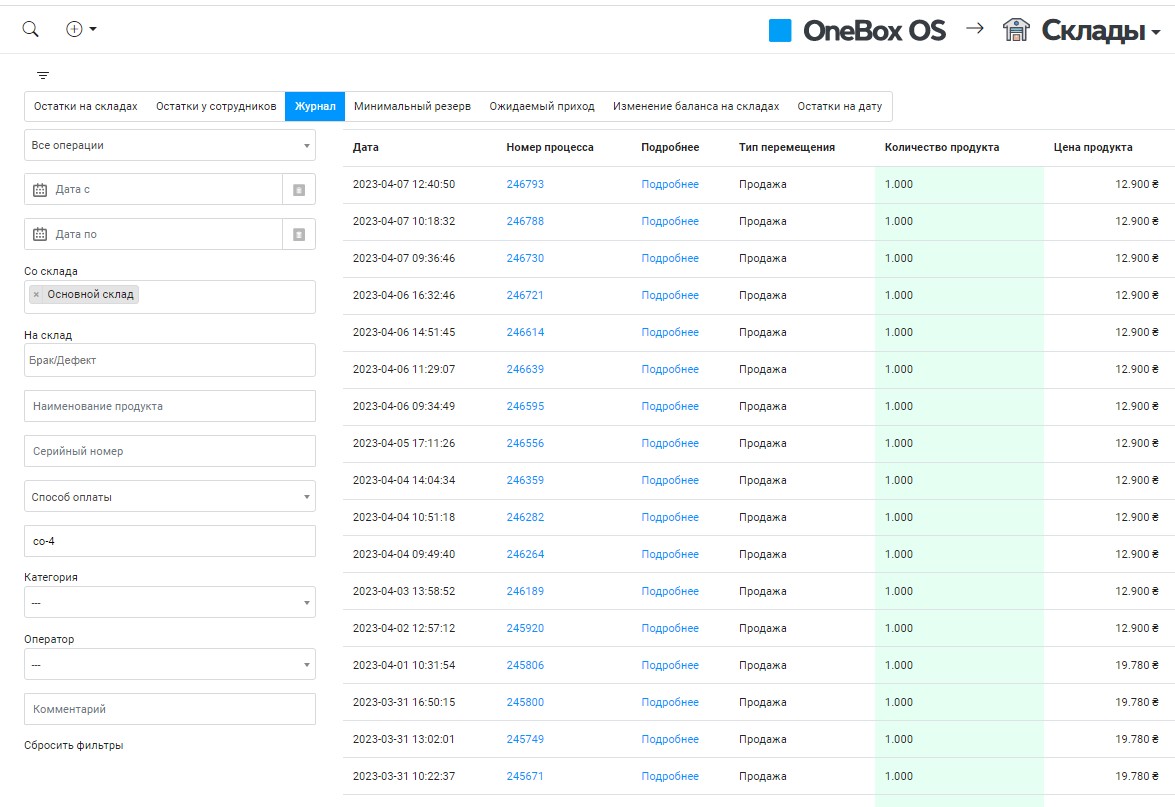
the display of the same in the Warehouse Journal in a general format is also interesting, is it possible to implement something for sales analysis, but here I think only the second part of the revisions is relevant only with grouping and graph
Please evaluate such improvements
Original question is available on version: ua
this makes it possible to understand how quickly the balance ends, to adjust purchases more quickly
It is also interesting to add the option to select a display with grouping in the filter
- day
- a week
- month
and an additional checkmark for this functionality is the sales schedule in the selected periods, which was displayed below when you select such a function
all this to increase the analysis of the sale of goods
the display of the same in the Warehouse Journal in a general format is also interesting, is it possible to implement something for sales analysis, but here I think only the second part of the revisions is relevant only with grouping and graph
Please evaluate such improvements

Answers:

Good afternoon. As far as I understand, the balance after the operation should be shown when you opened the product, then clicked Send to->warehouse->show product balance?
If yes, then there you can show the remains after the operation. Do you need balances for all warehouses or for a specific warehouse that was in operation? There's also a "balance before operation" field, can you just print it out?
Tarovik Dmitry Nikolaevich wrote:
still interested in the filter to add the ability to select a display grouped by
- day
- a week
- month
and an additional checkbox for this functionality is the sales chart for the selected periods, which was shown below when you select this function
please do not confuse the functionality of displaying warehouse operations and sales reports. No need to sculpt everything together, try to set up separate reports for yourself that will show sales by process in the course of days, weeks and months.
14.04.2023, 23:03
Original comment available on version: ru
.dev
OneBox production wrote:
Good afternoon. As far as I understand, the balance after the operation should be shown when you opened the product, then clicked Send to->warehouse->show product balance?
If yes, then there you can show the remains after the operation. Do you need balances for all warehouses or for a specific warehouse that was in operation? There's also a "balance before operation" field, can you just print it out?
Tarovik Dmitry Nikolaevich wrote:
still interested in the filter to add the ability to select a display grouped by
- day
- a week
- month
and an additional checkbox for this functionality is the sales chart for the selected periods, which was shown below when you select this function
please do not confuse the functionality of displaying warehouse operations and sales reports. No need to sculpt everything together, try to set up separate reports for yourself that will show sales by process in the course of days, weeks and months.
there are not sales in general, but for a product of interest, or for several products to receive a GRAPHIC report in the form of a graph decomposed into a selected period. I don’t know a report in which this can be done simply, and this additional action needs to be done, sent to the report.
the essence is this - there are numbers that do not say much without a graphic display, for example, a breakdown by year / quarter makes it possible to see the dynamics of the sale of a product, or a group of products, evaluate it and place an order for goods in advance (we have a purchase-delivery cycle in Ukraine 2, 5-3 months) and keeping the leftovers is a rather laborious process.
if there is such a report in which you can select a product / products and send and receive such a display, then this is acceptable, if not, then the cost of creating it
15.04.2023, 08:57
Original comment available on version: ru
There is such a report in the report designer, called "Purchase Forecast", display it and a filter for it, there will be sales and the quantity of goods needed for purchase based on past sales
27.04.2023, 23:18
Original comment available on version: ru
Please join the conversation. If you have something to say - please write a comment. You will need a mobile phone and an SMS code for identification to enter.
Log in and comment


Copyright © OneBox 2025


