Evaluate the revision: change the checkerboard interface
Good afternoon!
Colleagues, it is necessary to evaluate the refinement.
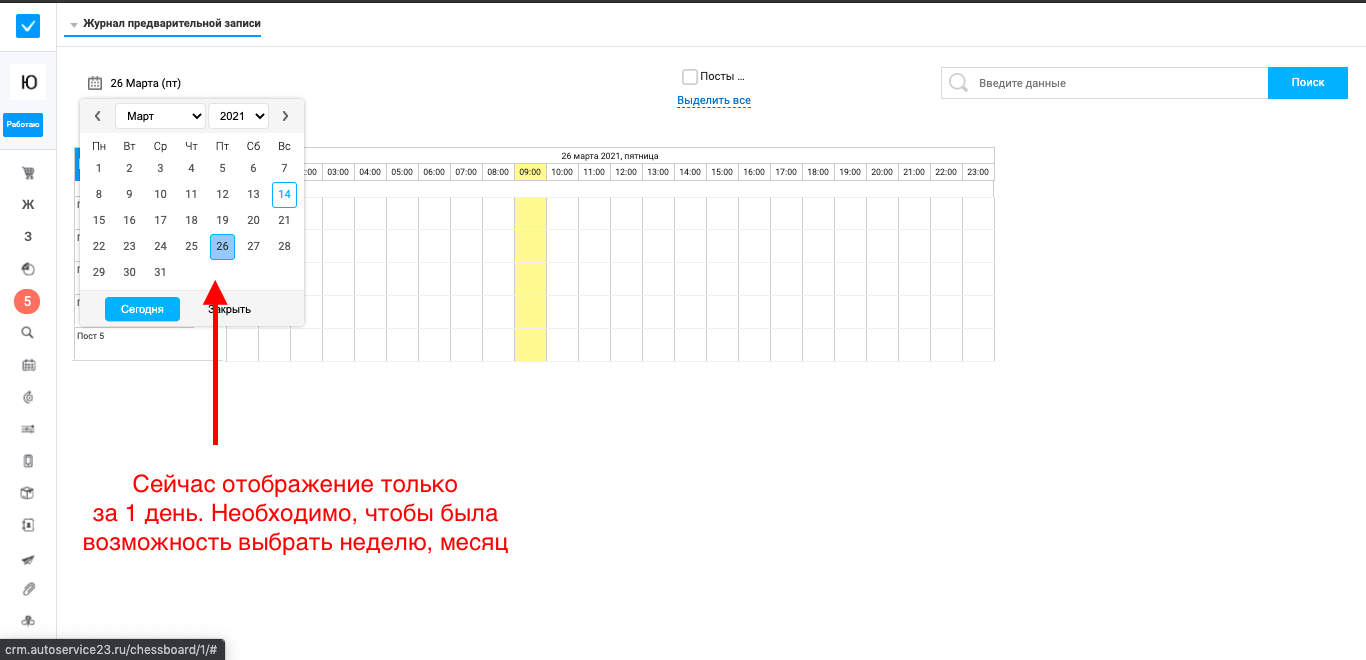
1. In the client's checkerboard, processes are displayed in the context of one day (as in the screenshot), it is necessary to make settings so that the client has the opportunity to switch the display of the checkerboard for a week, a month (at the same time, if an employee switches the display for a week, then all processes are displayed by the hour , if for a month, then only by days).
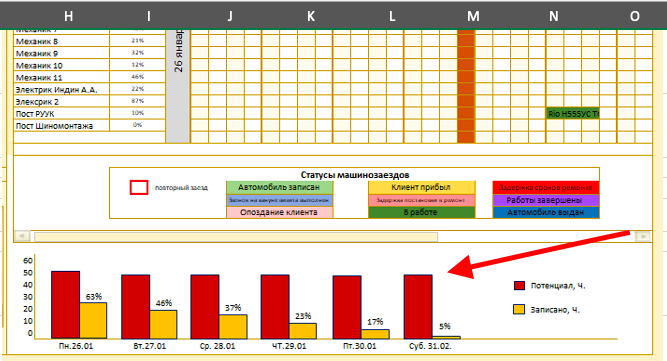
2. It is necessary that statistics be displayed at the bottom of the checkerboard in a chart format, as in the example
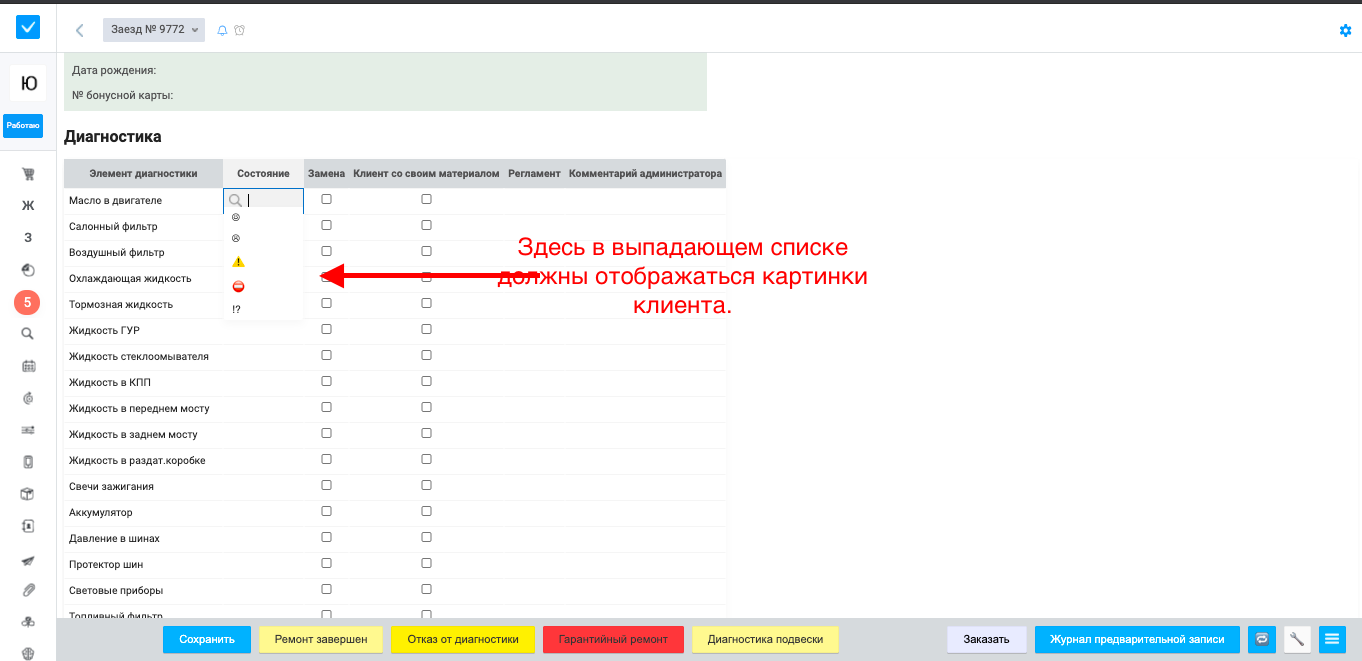
3. It is necessary that in the BP, in the table with services, in the required field, the pictures needed by the client are displayed (further pictures should also be displayed in the printed document), in jpg format (see example). Unicodes are now uploaded, but they do not suit the client.
Colleagues, it is necessary to evaluate the refinement.
1. In the client's checkerboard, processes are displayed in the context of one day (as in the screenshot), it is necessary to make settings so that the client has the opportunity to switch the display of the checkerboard for a week, a month (at the same time, if an employee switches the display for a week, then all processes are displayed by the hour , if for a month, then only by days).
2. It is necessary that statistics be displayed at the bottom of the checkerboard in a chart format, as in the example
3. It is necessary that in the BP, in the table with services, in the required field, the pictures needed by the client are displayed (further pictures should also be displayed in the printed document), in jpg format (see example). Unicodes are now uploaded, but they do not suit the client.
Снимок экрана 2021-03-26 в 10.51.22.png
Снимок экрана 2021-03-26 в 10.56.24.png
Снимок экрана 2021-03-26 в 11.00.57.png
Original question is available on version: ru

Answers:

1. I can only suggest that you make 2 checkerboard displays - and use the one you need as needed.
2. Will you indicate the logic?
3. We will not do this. I recommend thinking about an additional field of the "Text" type, where the action, depending on the value of another selector, is to fill in the layout of the output of the desired image - and it will be shown in the table of process products (there were projects where it was configured in a similar way)
26.03.2021, 17:58
Original comment available on version: ru
1. Please describe how the client will use this option in the end? In the initial request, the client would like to simply select the display type (day, week, month) and the system would show him the desired table.
2. The logic is as follows: in the graph format, the number of working hours of all car service posts per day is displayed (we have 5 posts that together work 60 hours a day).
The amount of time in total is displayed in the first column (highlighted in red).
The second column displays the sum of all recorded cars for all posts for the current day (for example, post 1 recorded 2 cars for 3 hours of work, post 2 recorded 1 car for 1 hour, total 4 hours busy).
then we calculate the % (which is displayed in the second column) of the download of all posts per day = the sum of the hours of recorded cars divided by the available number of hours per day (in our example it will be 4 hours / 60 hours * 100 = 7%).
Next, we display visually these 7% in the 2nd column.
29.03.2021, 10:41
Original comment available on version: ru
1. Please describe how the client will use this option in the end? In the initial request, the client would like to simply select the display type (day, week, month) and the system would show him the desired table.
Just like you create 1 checkerboard per view, you create 2 for different views.
If you make a switch in the 1st block of dates so that it affects the others, this is a refinement that will take about 12 hours.
2. The logic is as follows: in the graph format, the number of working hours of all car service posts per day is displayed (we have 5 posts that together work 60 hours a day).
The amount of time in total is displayed in the first column (highlighted in red).
The second column displays the sum of all recorded cars for all posts for the current day (for example, post 1 recorded 2 cars for 3 hours of work, post 2 recorded 1 car for 1 hour, total 4 hours busy).
then we calculate the % (which is displayed in the second column) of the download of all posts per day = the sum of the hours of recorded cars divided by the available number of hours per day (in our example it will be 4 hours / 60 hours * 100 = 7%).
Next, we display visually these 7% in the 2nd column.
Unfortunately, I do not understand where and in what form you will write the initial data for the charts and why this should be done specifically for the chessboard?
30.03.2021, 16:48
Original comment available on version: ru
For question 2.
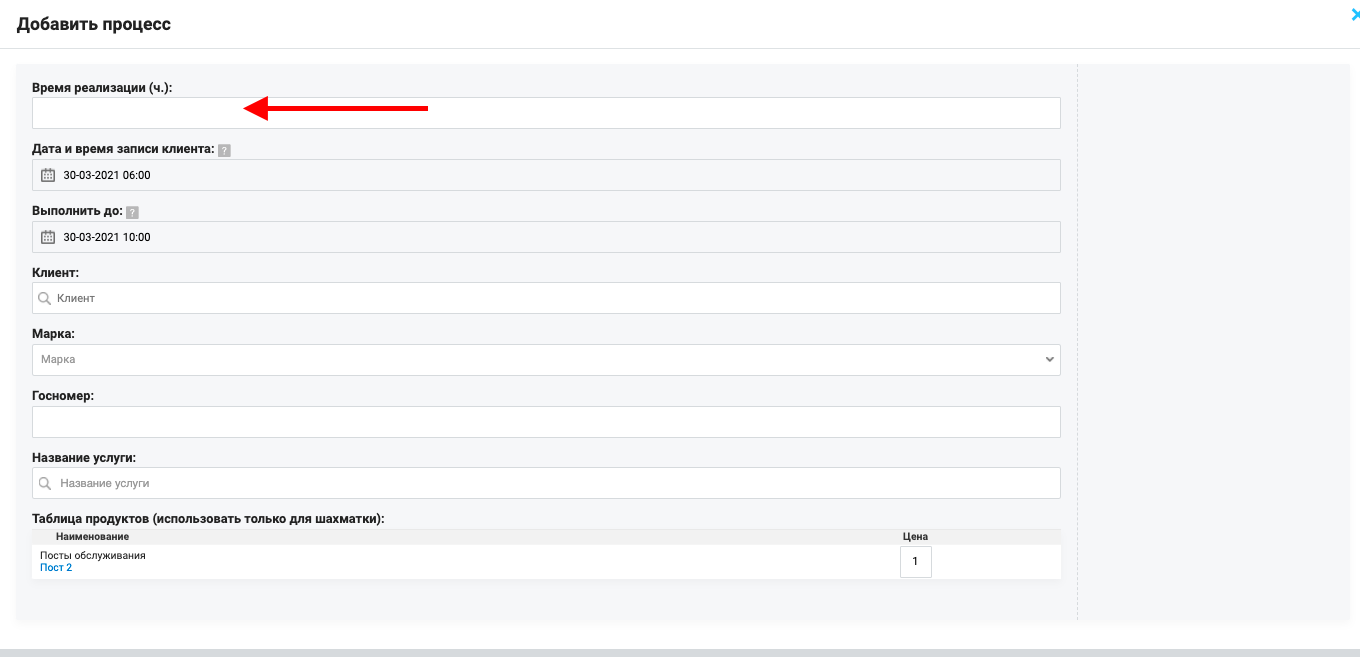
Attached is a screen of an already created checkerboard, where clients are recorded for a car service. We select the date and time of the recording, and we start the process (also in the attachment), in the process there is a field "Implementation time", which will display the number of hours spent on the service. It is from this field that we will take the value for calculating the load of posts.
"why does this need to be done specifically for chess?" - the wish of the client.
30.03.2021, 17:47
Original comment available on version: ru
Attached is a screen of an already created checkerboard, where clients are recorded for a car service. We select the date and time of the recording, and we start the process (also in the attachment), in the process there is a field "Implementation time", which will display the number of hours spent on the service. It is from this field that we will take the value for calculating the load of posts.
And where will you indicate how long a post works? It's a product, it doesn't have a work schedule per se...
Or do you want to set a total figure in the block, and then calculate by day how many processes from the desired product category are there on that day and the sum of their additional field?
30.03.2021, 17:58
Original comment available on version: ru
"Or do you want to set the total figure in the block, and then calculate how many processes from the desired product category are there on that day and the sum of their additional field relative to it?"
About Yes. To be more precise, I would like to set the "total figure" in a block within the number of hours per day - how long the post works, something like a work schedule. For example, we would set "working hours" and the system would immediately calculate the time difference in hours and this would be the total number for it.
And then in the process we will calculate the hours based on the "Schedule" and "Due until" dates - how long the post will be occupied and summarize all this for all records in the product.
Accordingly, on the basis of two numbers, you need to build diagrams.
And it is also important that this is displayed in a graph, as in the example.
Or you want to set a total figure in the block - we need to sum up the hours for all posts per day - from this figure we will calculate the workload of the post.
30.03.2021, 18:40
Original comment available on version: ru
To be more precise, I would like to set the "total figure" in a block within the number of hours per day - how long the post works, something like a work schedule.
Or you want to set a total figure in the block - we need to sum up the hours for all posts per day - from this figure we will calculate the workload of the post.
No one will do the work schedule for the Product entity, this makes no sense as such.
Will the work schedule vary by date, or will it be a maximum by day? And will it be the same for all products, or different?
31.03.2021, 16:45
Original comment available on version: ru
Will the work schedule vary by date, or will it be a maximum by day? - Our work schedule will be the same every day - 60 hours.
And will it be the same for all products, or different? - everyone is the same.
And will it be the same for all products, or different? - everyone is the same.
01.04.2021, 12:17
Original comment available on version: ru
Well then, let's make a block in which you will specify the general threshold value for the 1st product (for example, 8).
Further, depending on the number of products filtered in the checkerboard (in the example - 5), we get the maximum value for the chart = 40.
Further, for each product, we calculate the sum of the additional field (will be indicated in the block) for the processes filtered for the checkerboard period and in the corresponding BP and, based on the calculated ones, display similar charts using the Google Column Chart.
The development of such a block will take about 10 hours, because it will be necessary to make changes to other checkerboard blocks for joint performance.
01.04.2021, 17:28
Original comment available on version: ru
Please join the conversation. If you have something to say - please write a comment. You will need a mobile phone and an SMS code for identification to enter.
Log in and comment


Copyright © OneBox 2025


